
Research: Identify 6 Infographics
Infographic 1: Endangered Animals
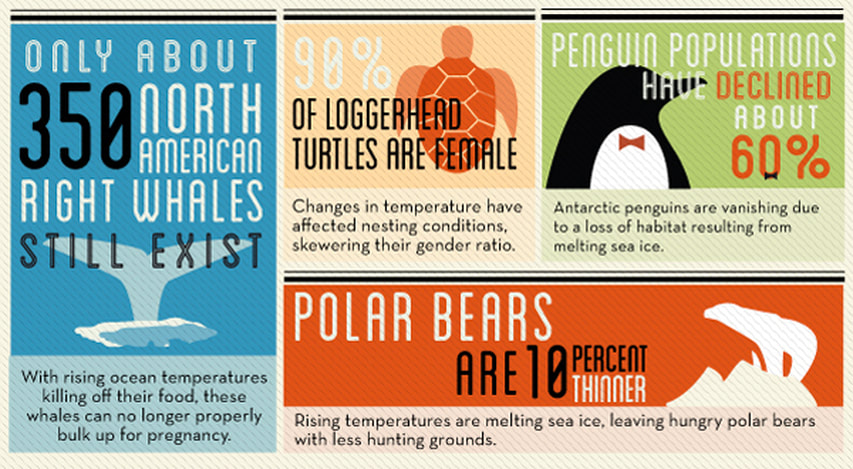
This first infographic is all about endangered species. The page is split up into four different sections, each containing information about a different species. The information is shown by simple typography detailing a percentage or a fact about that specific animal with a simple vector based image of the animal within that area of the infographic. No visual representation is show however it is very easy to understand and digest the information given about each animal and how endangered they are. The purpose of this infographic is clear, these animals are become instinct and action must be taken. The action is unclear but the message of how these animals are in need desperately is clear.
Infographic 2: Climate Change
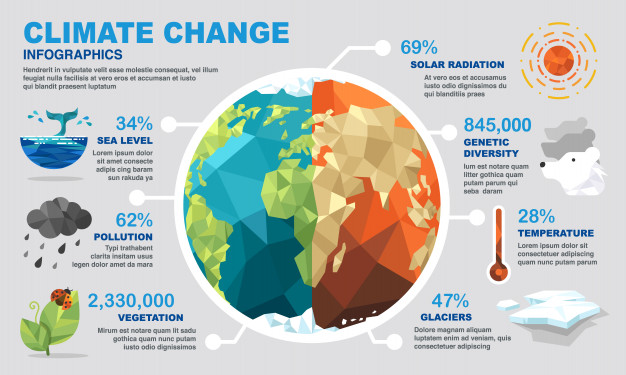
The second infographic details climate change and it's effects. In the centre of it all is a globe in a simple vector based illustration. The globe is split into two different sides; one being blue and green, the other being an orange and yellow - this shows the visual impact of climate change possibly. The globe has lines coming off it with information about the world and the impacts of climate change. Each fact has a small illustration along with a title of one of the impacts of global warming and a small paragraph explaining this impact. This infographic is very clear in its message about the effects of global warming as it shows many different changes and impacts. It is extremly easy to read and can be digested very quickly by a viewer.
Infographic 3: Global Warming
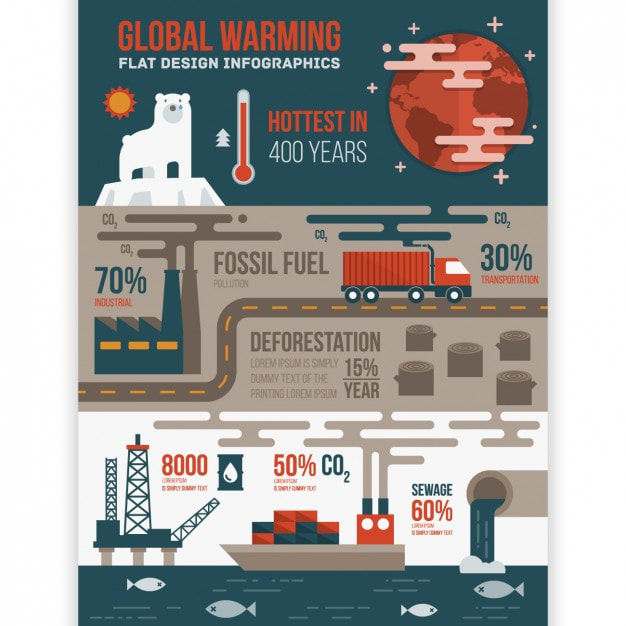
This infographic contains information and facts about global warming. Many statistics are layed around the poster detailing what causes global warming. The colour scheme and style of this infographic is very simple and flat to be made easy to look at and understand. Not much typography is in this infographic however the numbers and percentages show much more information by having illustrations next to them. Each section is linked up with steam-like lines to further link to the theme of pollution and global warming. This infographic is very clear with its message and purpose, detailing what causes global warming and is very easy to understand and digest for an average person.
Infographic 4: Ways to reduce contribution to climate change.
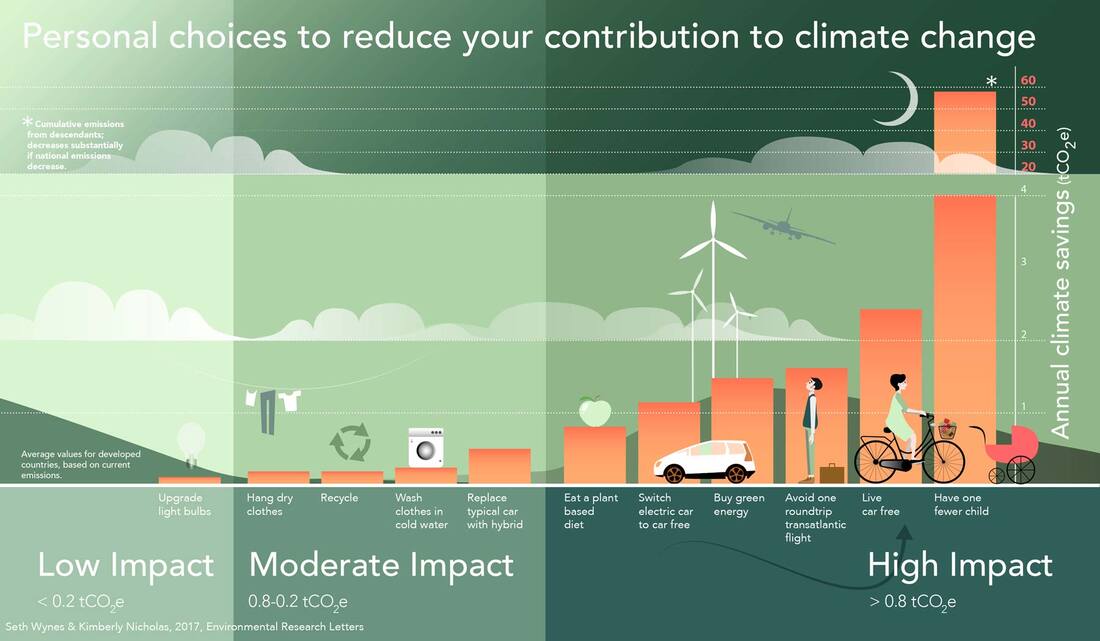
This infographic is all about ways you, yourself can reduce the contribution to climate change. This is shown through a graph in the middle of the poster with how each of the different choices will help prevent climate change increasing. Each graph is supported by a small, simple illustration along with the bar being a red/orange colour to contrast with the green background. It is incredibly simple to understand and to read what this infographic is about how each contribution adds to reducing climate change.
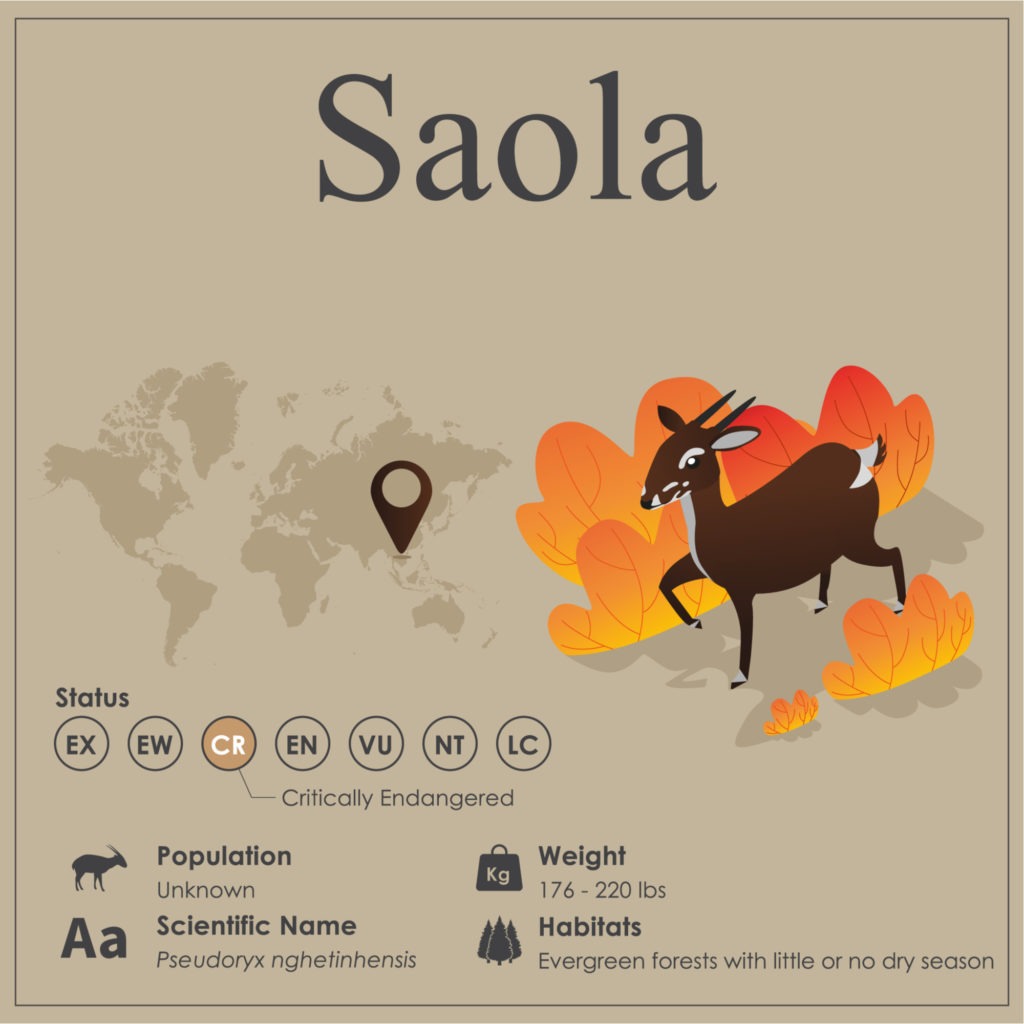
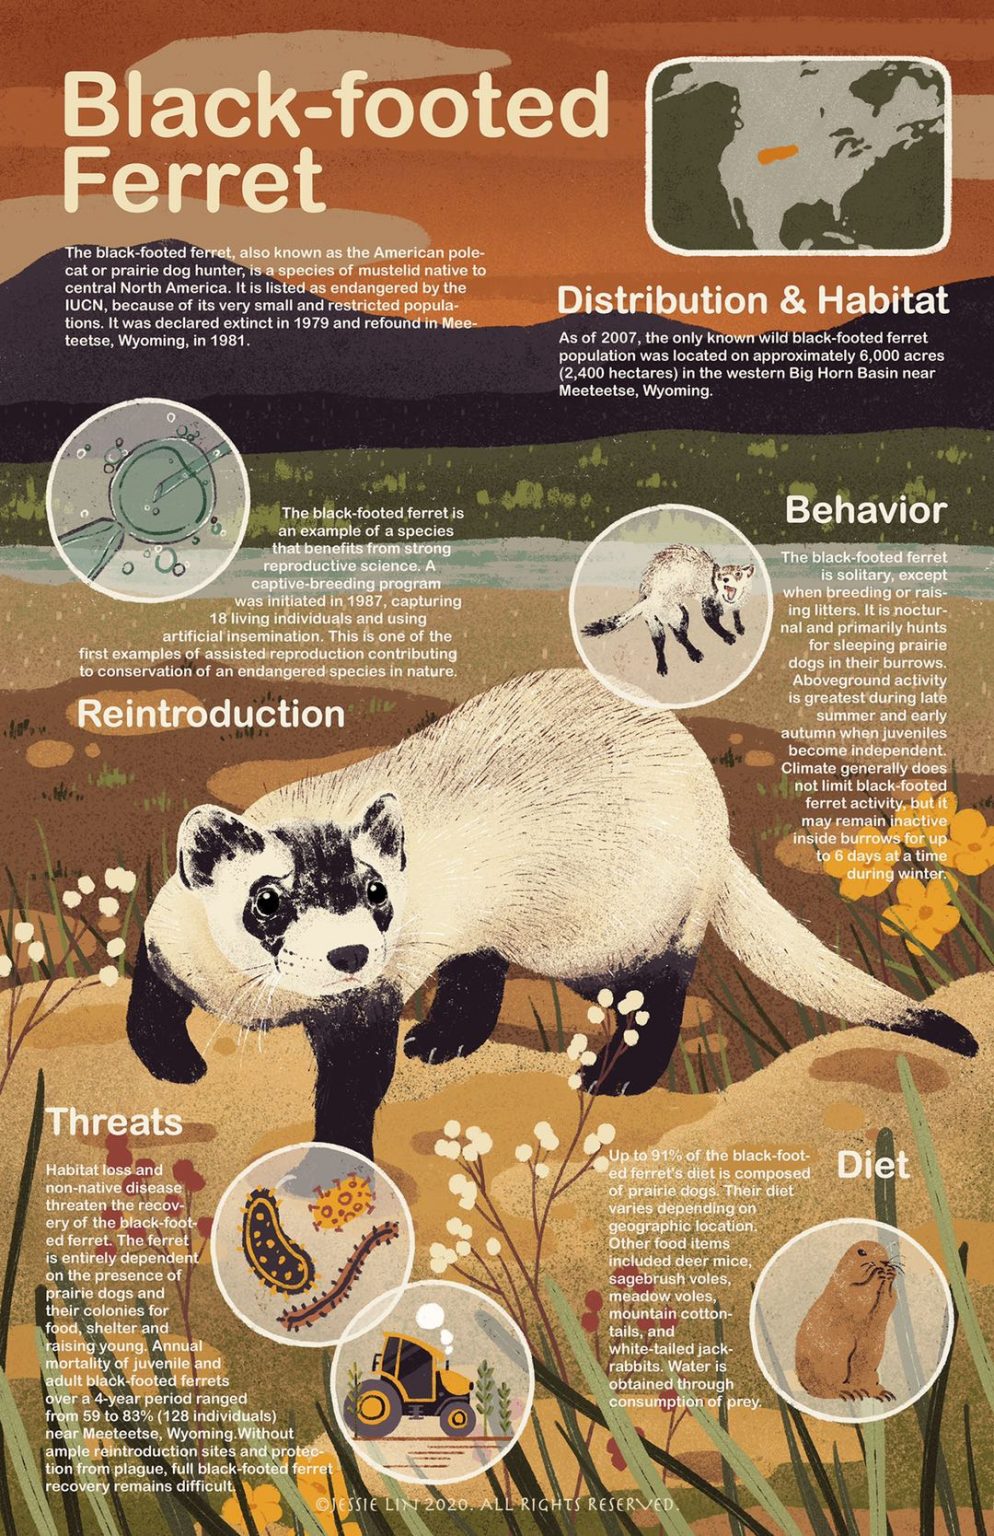
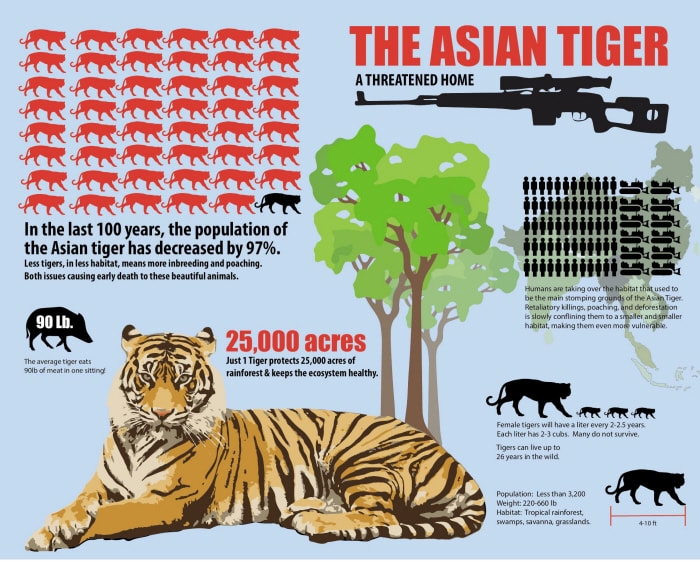
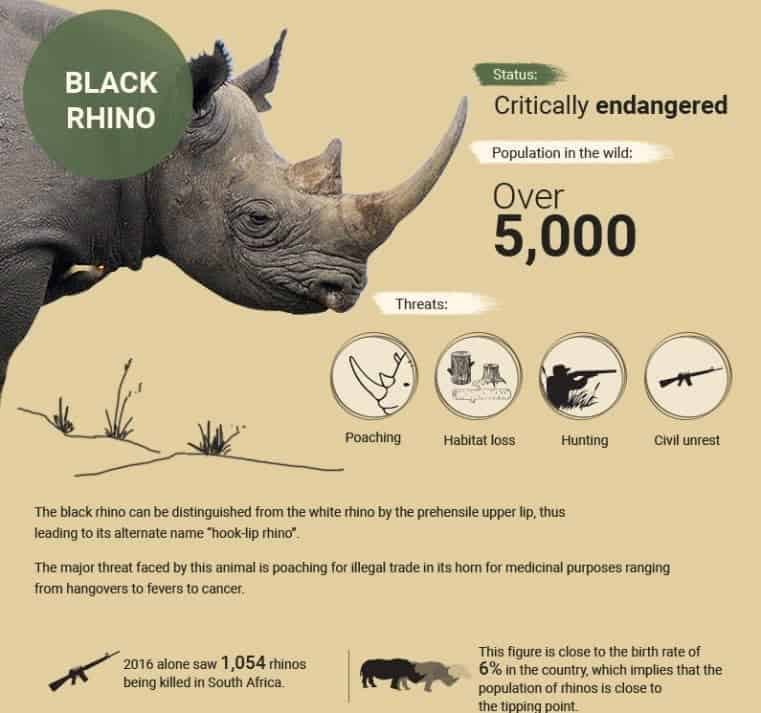
Infographic 5: Endangered Species
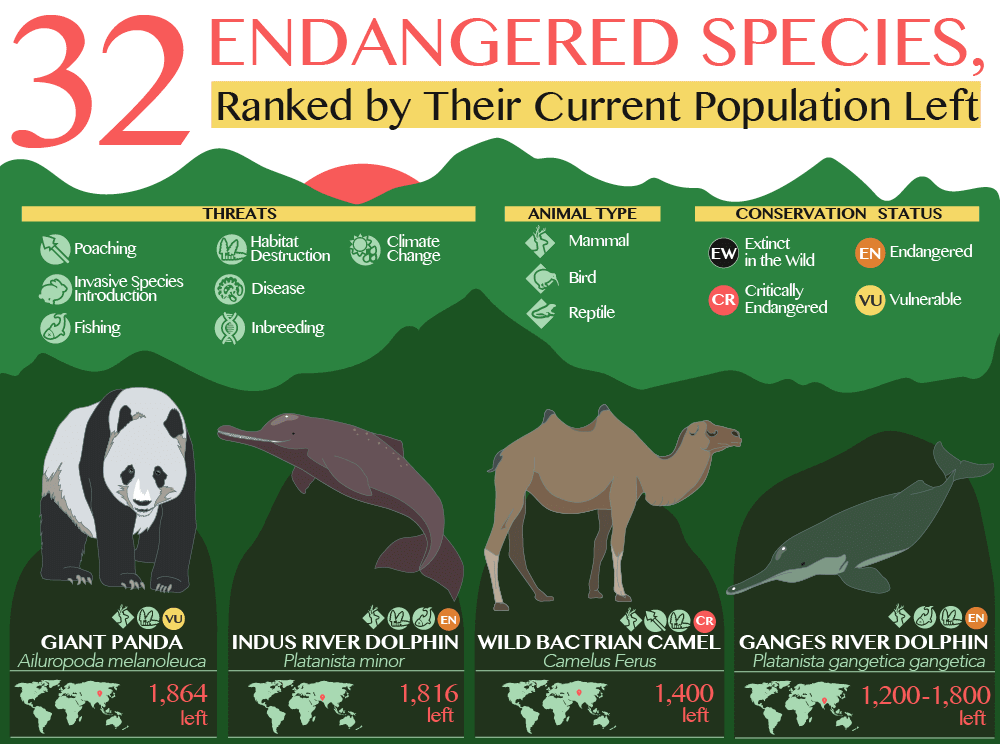
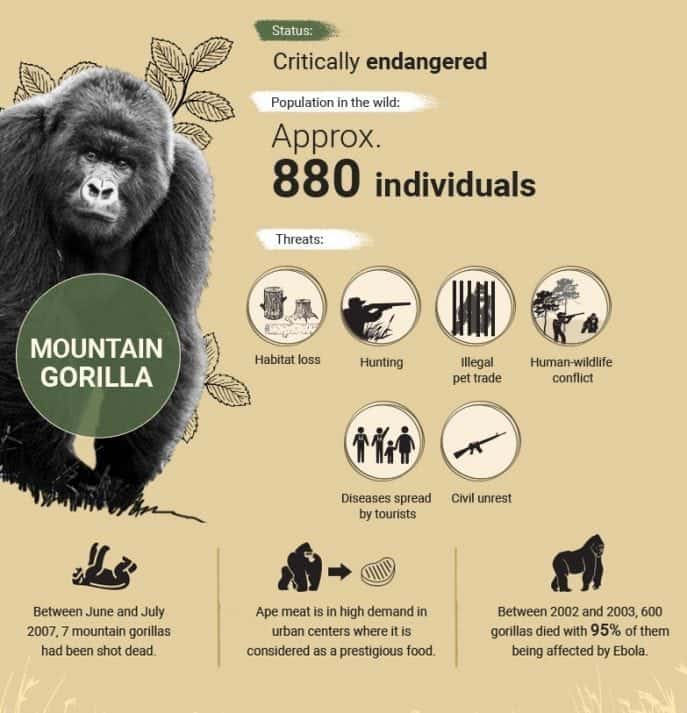
The infographic above displays very detailed information about endangered species. Each of the four animals displayed contains very detailed information about the species threats, their animal type, conservation status, where they are located, how many are left, what they look like. This is all backed into a small poster along with simple illustrations of the animal. This infographic displays lots of new information for a person to learn and undersand about each animal and shows a clear message of the exctint animals.
Infographic 6: Panda Express
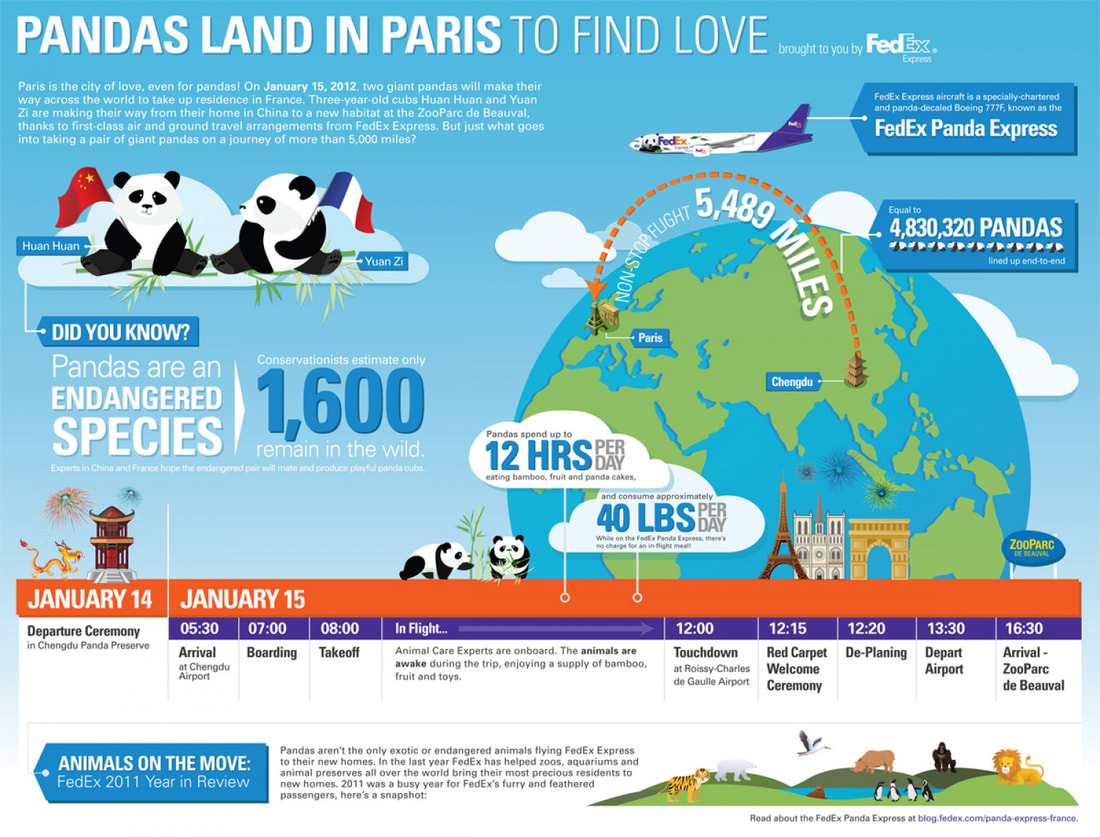
The final infographic is about Pandas and their travel to Paris. This infographc is very details and contains a lot of information about how two pandas traveled from 'Chengdu' in China to 'Paris' in France. The infographic contains a paragraph about the journey, illustrations of the timeline of the journey and scattered facts about the flight such how many Pandas this flight would eqaul to if they were all lined up. This infograph contains a lot of information that would take a lot of time to fully read however the information is displayed well enough to not be overwhelmed as each section of information is spread out and not overlapped so there is a sense of 'structure' or 'flow'.
Research
My chosen endagered species is the Panda which I will be making a infographic on.
I began by researching this animal. Here are some cool facts about this animal:
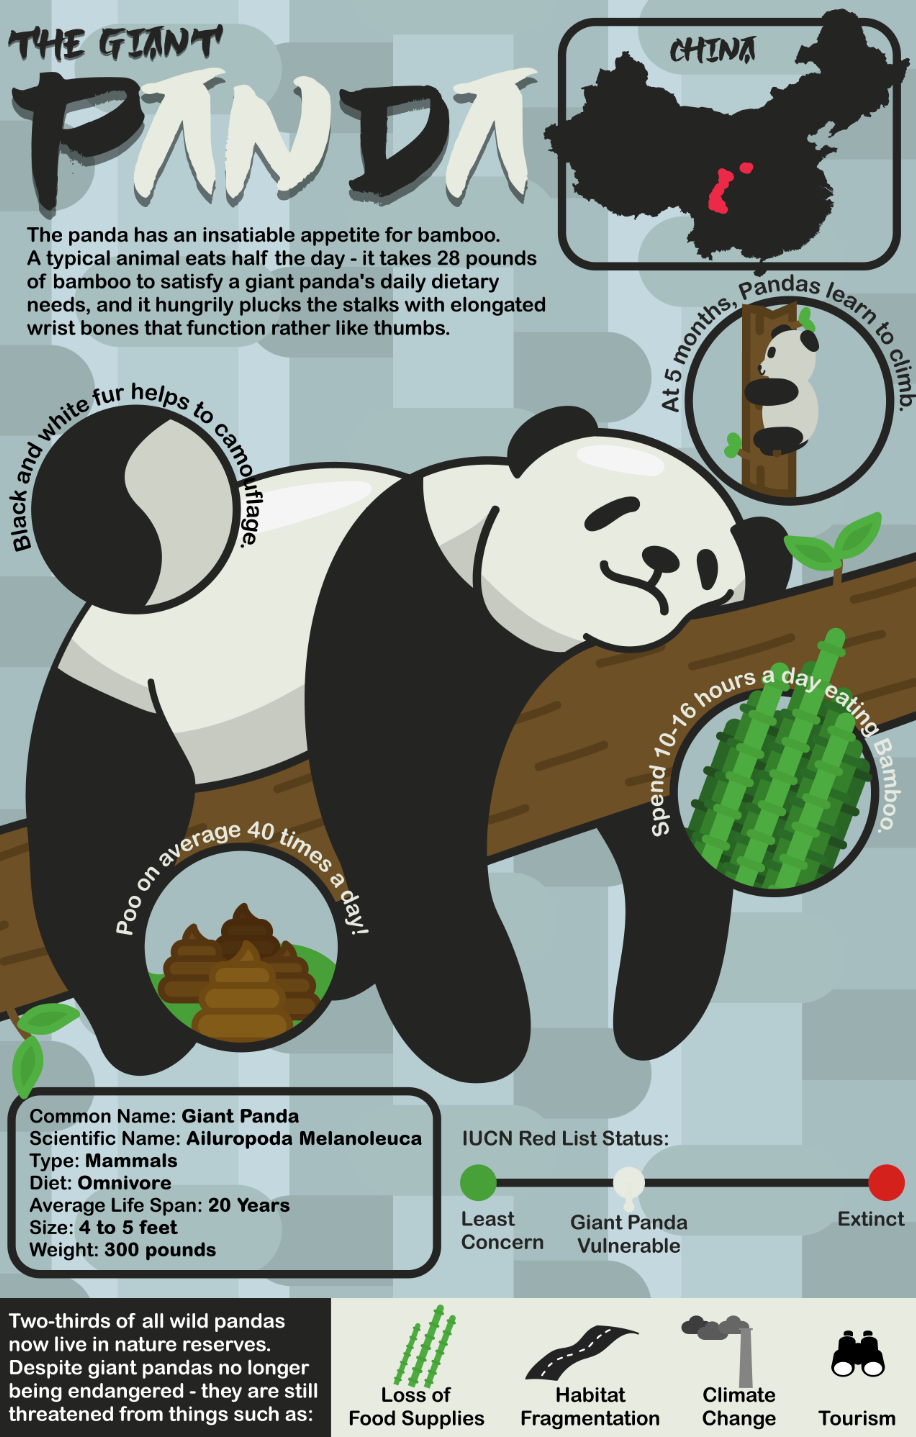
1. Panda's distinctive black-and-white markings help camouflage them. The white is to help hide in snowy habitats whereas the black helps hide in shade.
2. Humans have cleared much of the bamboo forests that pandas need to survive. Because pandas eat mostly only bamboo, they cannot adapt to live outside of those forests the way other animals do, unless the pandas are provided with bamboo.
3. Pandas also have difficulty reproducing, even in captivity, due to their extreme choosiness about their mates, their low-nutrient milk and the fact that they usually only have one viable cub at a time.
4. Panda skins and pelts can fetch poachers hefty sums of money on the black market. China has strict penalties for anyone caught poaching pandas, but some poachers persist, in spite of the risks.
5. At five months old, giant pandas learn how to climb.
6. Pandas have extended wrist bones that they use like a thumb to help them grip food.
7. They also spend 10-16 hours a day feeding, mainly on bamboo.
8. Pandas need at least 2 different bamboo species in their range to avoid starvation.
9. To mark their scent, pandas climb a tree backwards with their hindfeet until their in a full handstand upside down!
10. Pandas on average poo 40 times a day!
The giant panda is a bear native to the south China. They live mainly in temperate forests high in the mountains of southwest China, where they subsist almost entirely on bamboo. They must eat around 26 to 84 pounds of it every day, depending on what part of the bamboo they are eating.
I began by researching this animal. Here are some cool facts about this animal:
1. Panda's distinctive black-and-white markings help camouflage them. The white is to help hide in snowy habitats whereas the black helps hide in shade.
2. Humans have cleared much of the bamboo forests that pandas need to survive. Because pandas eat mostly only bamboo, they cannot adapt to live outside of those forests the way other animals do, unless the pandas are provided with bamboo.
3. Pandas also have difficulty reproducing, even in captivity, due to their extreme choosiness about their mates, their low-nutrient milk and the fact that they usually only have one viable cub at a time.
4. Panda skins and pelts can fetch poachers hefty sums of money on the black market. China has strict penalties for anyone caught poaching pandas, but some poachers persist, in spite of the risks.
5. At five months old, giant pandas learn how to climb.
6. Pandas have extended wrist bones that they use like a thumb to help them grip food.
7. They also spend 10-16 hours a day feeding, mainly on bamboo.
8. Pandas need at least 2 different bamboo species in their range to avoid starvation.
9. To mark their scent, pandas climb a tree backwards with their hindfeet until their in a full handstand upside down!
10. Pandas on average poo 40 times a day!
The giant panda is a bear native to the south China. They live mainly in temperate forests high in the mountains of southwest China, where they subsist almost entirely on bamboo. They must eat around 26 to 84 pounds of it every day, depending on what part of the bamboo they are eating.
Endangered Species
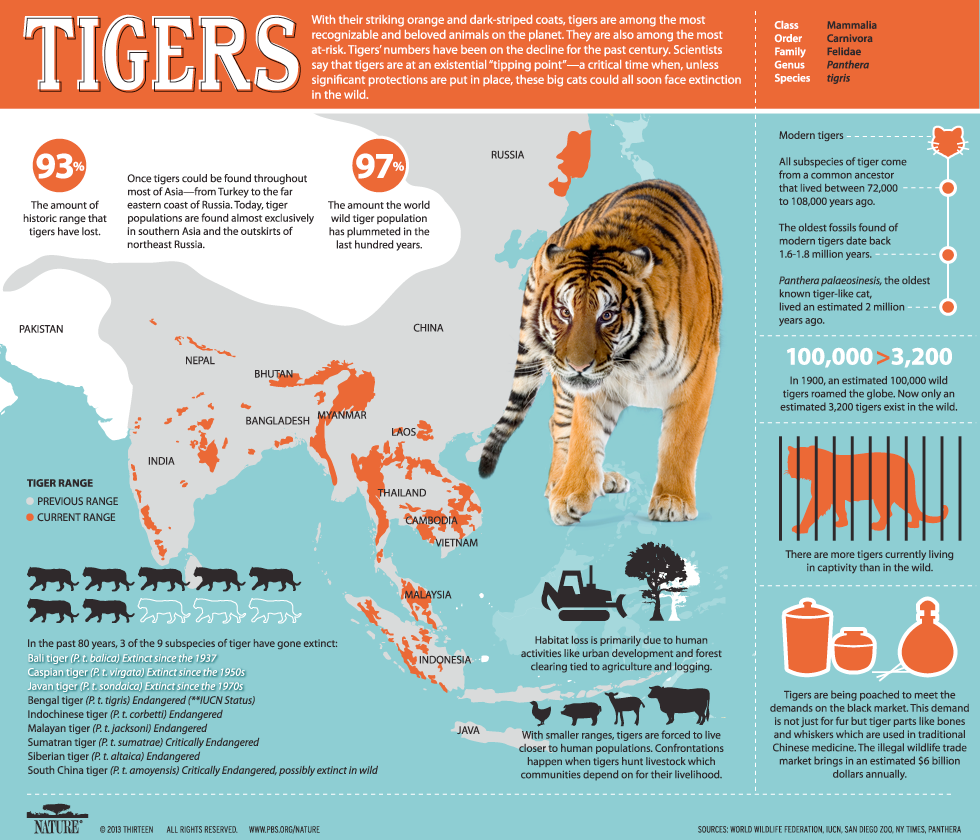
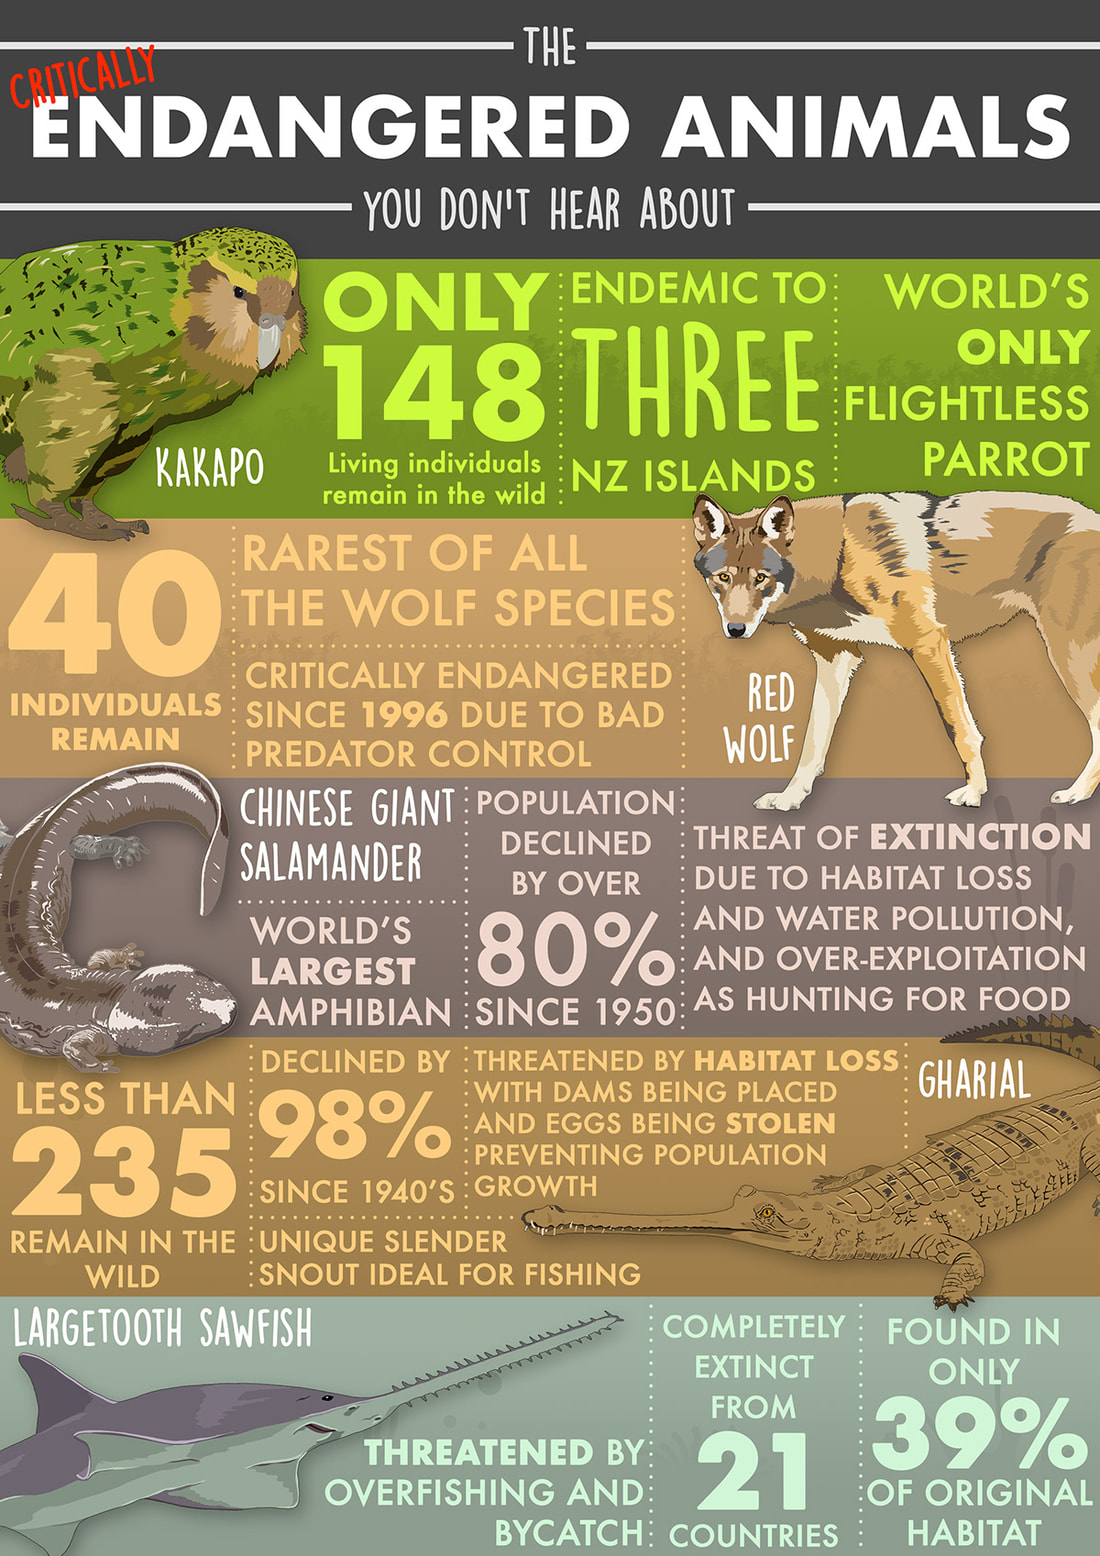
I then looked at 8 infographics about endangered species to use for inspiration for my own.
|
|
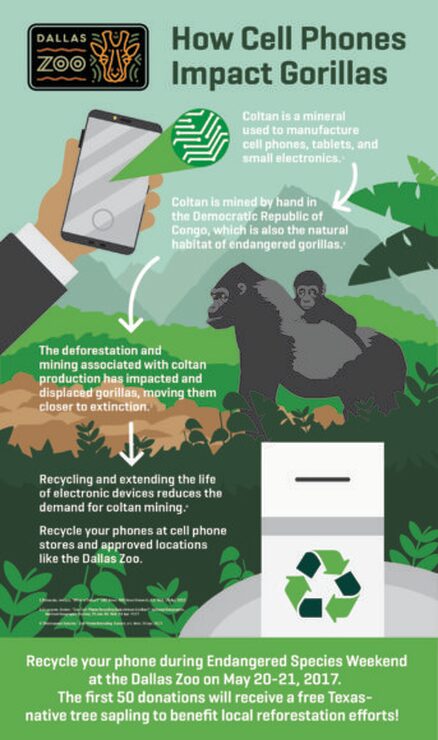
What I found was the mostly all these found infographics use a similar style. Mostly all use a Sans Serif font and simple flat colours. The background is very simple with not many details and an image/illustration of the animal in context is used along with other illustrations with information on how the animal/species is affected. Most also contain a sense of 'structure' so a viewer would follow a specific layout to read the information rather than going back and forth, this can be seen in ways such as the "How Cell Phones Impact Gorillas" where there are arrows to tell the eyes where to follow next.
My Infographic
My infographic will be about the endangered Panda. I plan to display some information about the panda such as where they live, what they eat, how they are endangered. I will also include some information on how to keep them alive.
The main message of my infographic will be raise awareness about the Panda, what makes them interesting which in result will be the reasoning why they should be kept alive and help stop them being endangered. My infographic will be aimed at a rage of audiences. I will include illustrations to appeal to a younger audience as well as information to be able to read by a more mature audience - this way it will reach a wider audience.
The main message of my infographic will be raise awareness about the Panda, what makes them interesting which in result will be the reasoning why they should be kept alive and help stop them being endangered. My infographic will be aimed at a rage of audiences. I will include illustrations to appeal to a younger audience as well as information to be able to read by a more mature audience - this way it will reach a wider audience.
Typefaces
With this, I began to look for typefaces and fonts that would match my Panda infographic.
Visit the font page by clicking on each one.
Visit the font page by clicking on each one.


|


|
I first looked at Sans Serif fonts as inspired by the research I found above.


|


|
I then looked into eroded and distorted fonts which I might use to replicate the nature the pandas are in - forests.

|

|
Lastly I picked two fonts which are 'Asian inspired' fonts which is where the pandas live.
Colour Scheme
I then followed this by looking for suitable colour schemes. I used a website called "Coolors" to generate some colours palettes. The idea from the start was definitely use Black and White within the colour palette as these were the colours of the pandas. I looked into what colours would work well with these two contrasting colours. Green was an important colour due to the pandas habitat and also the colour of their favourite food: Bamboo.


Sketches and Development
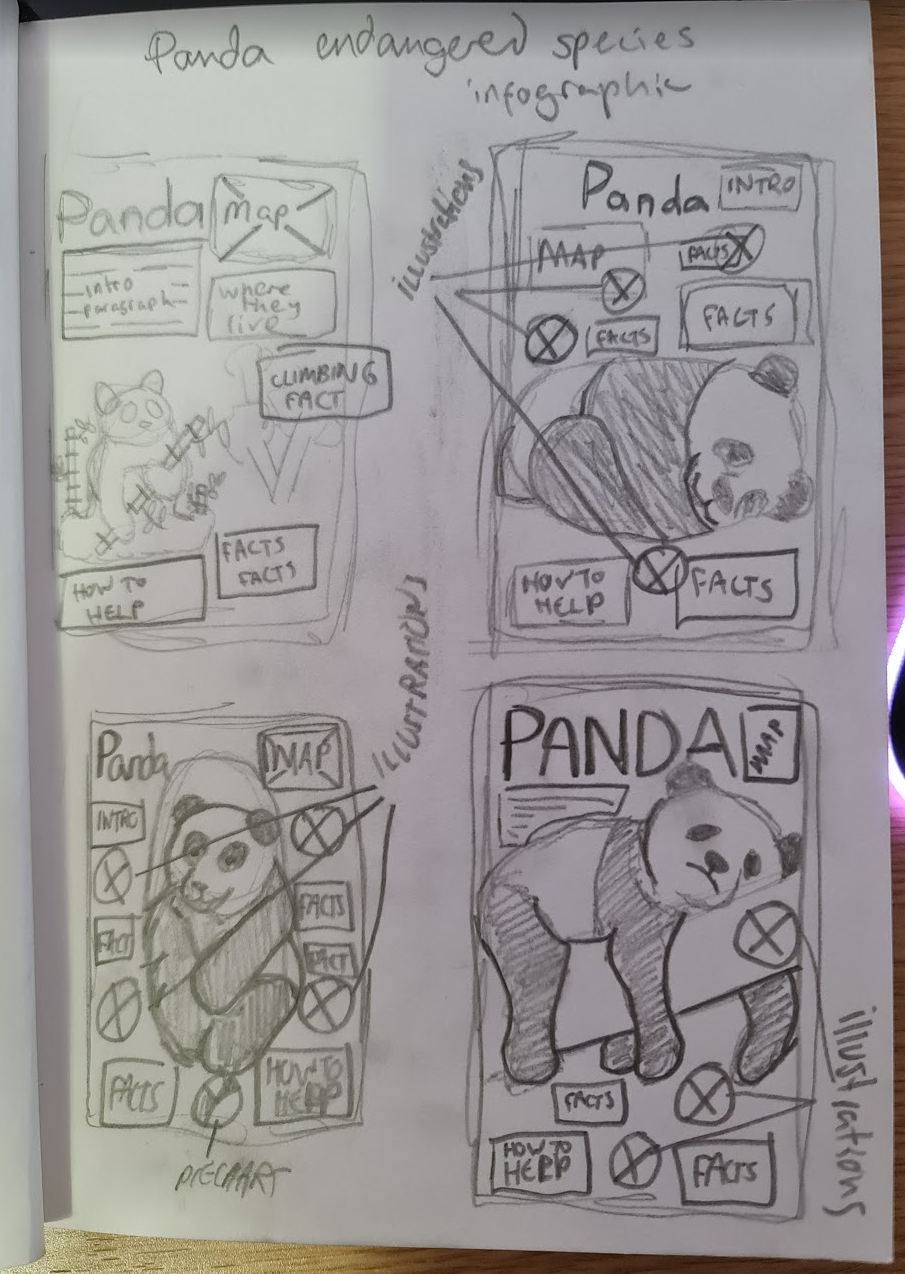
I then began creating sketches and ideas on paper on how I would make my infographic about the Panda. These are the four ideas I came up with.
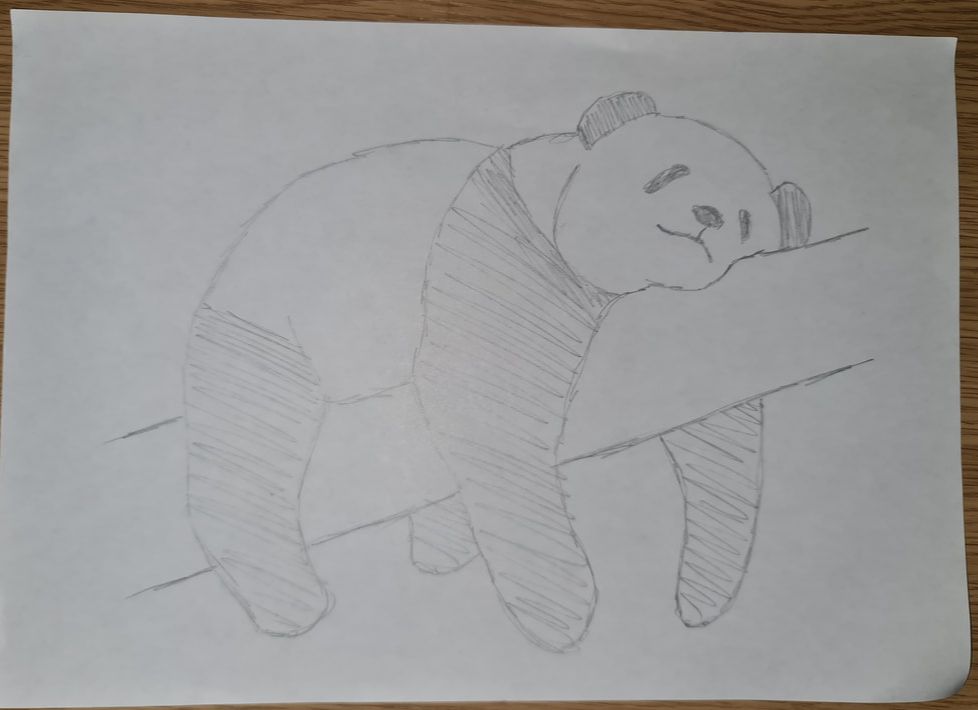
I then sketched a better picture of the panda that I would use for my infographic which I then digitalised into Adobe Illustrator.
|
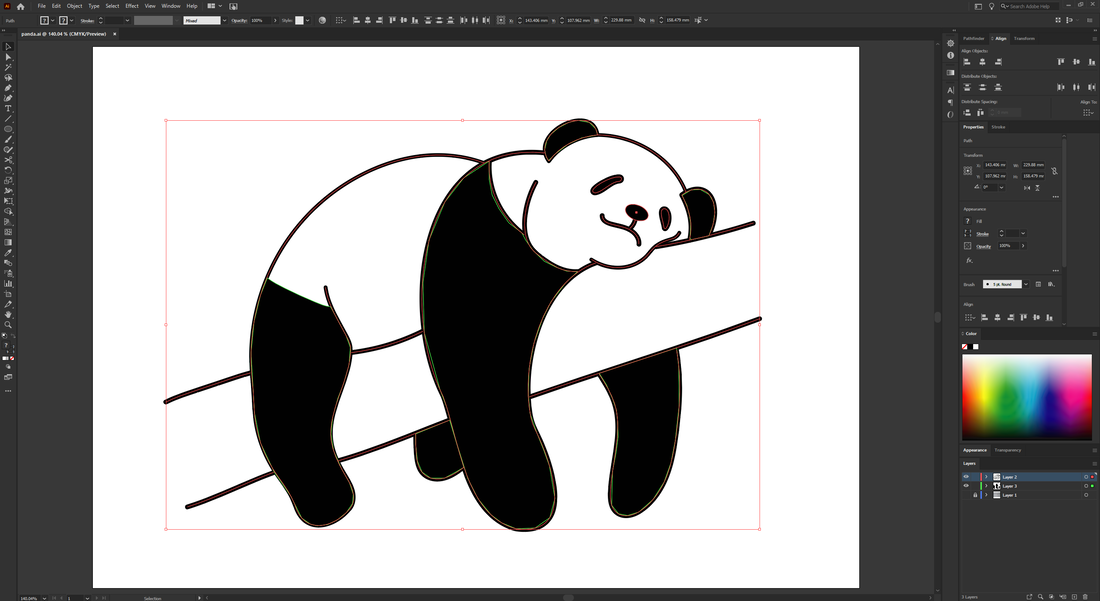
|

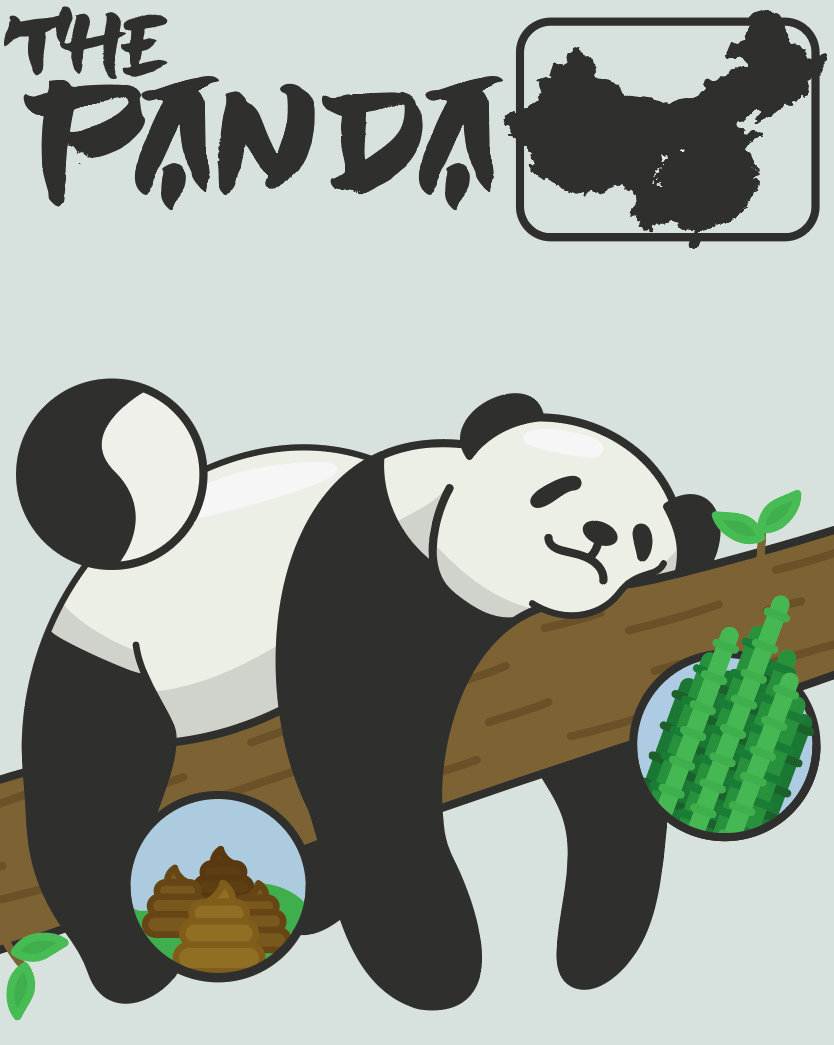
Using the previous colour scheme I found, I began colour in the panda.

|

|
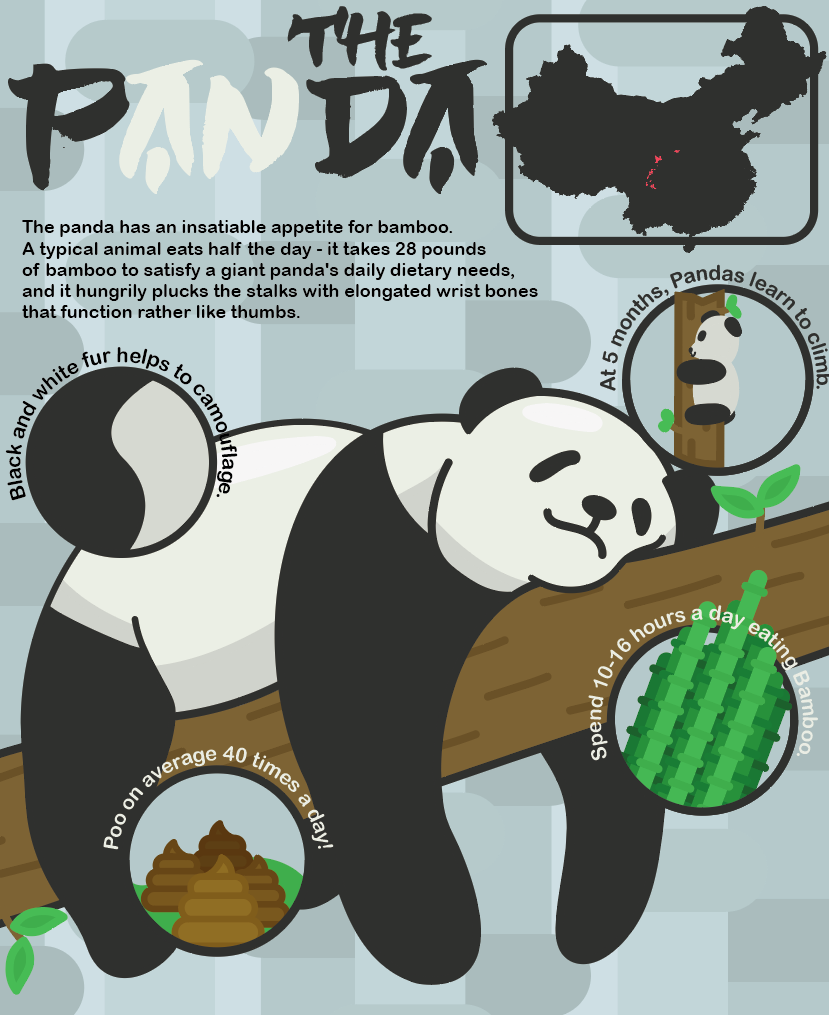
I then added the title "The Panda" along with a map of China to show where these pandas live.
I then began adding circles with illustrations inside to add as facts about the pandas.
I then began adding circles with illustrations inside to add as facts about the pandas.

|
|
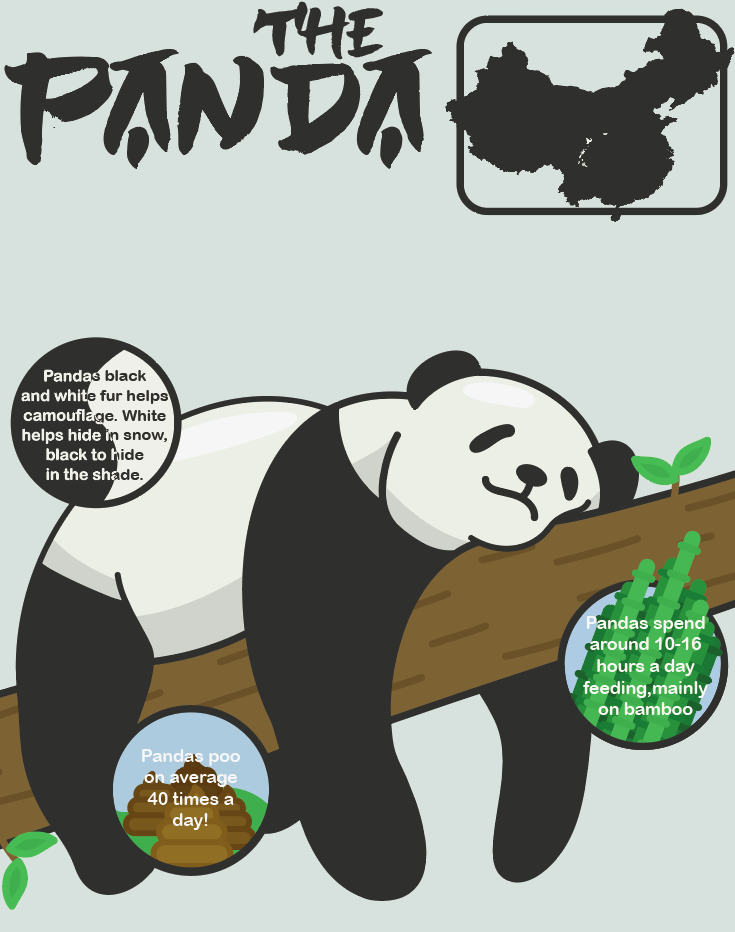
I first tried to add the typographic facts ontop of the illustrations however that did not look too good as it was hard to read and so I removed it. I also added an introduction paragraph about the panda as well changing the background to a bamboo flat style to make it more interesting.
I also made the title 'The Panda' use the same colours as the panda being white and black.
I also made the title 'The Panda' use the same colours as the panda being white and black.
|
|
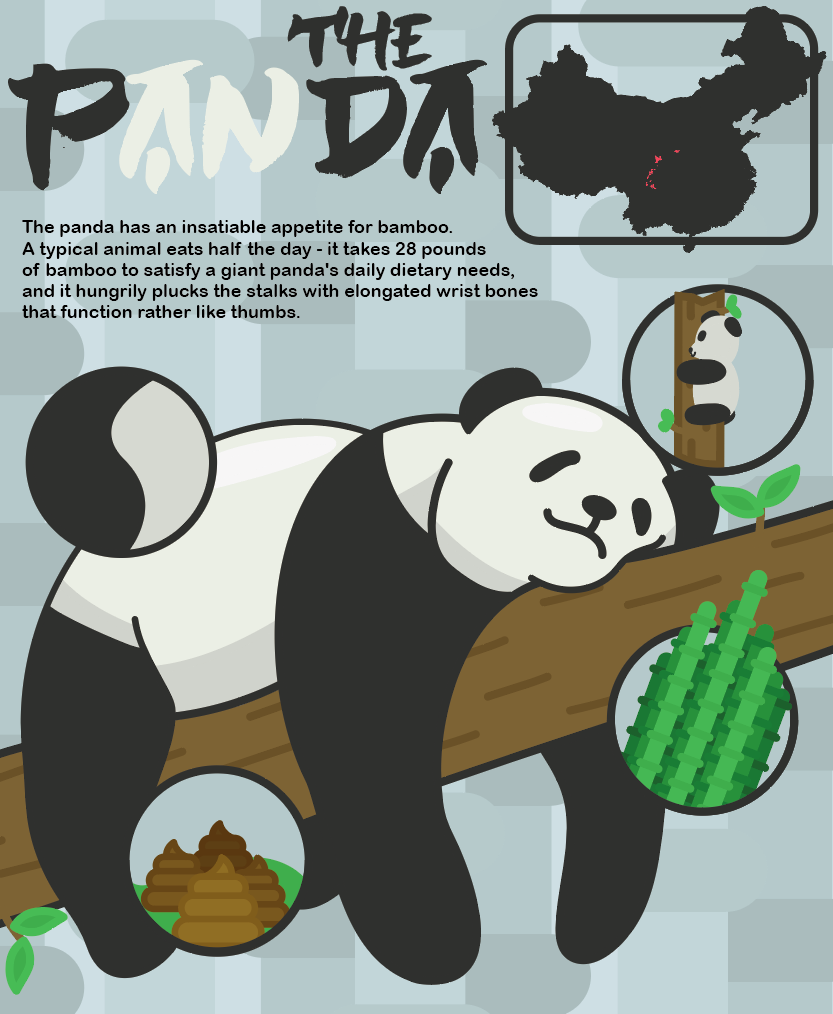
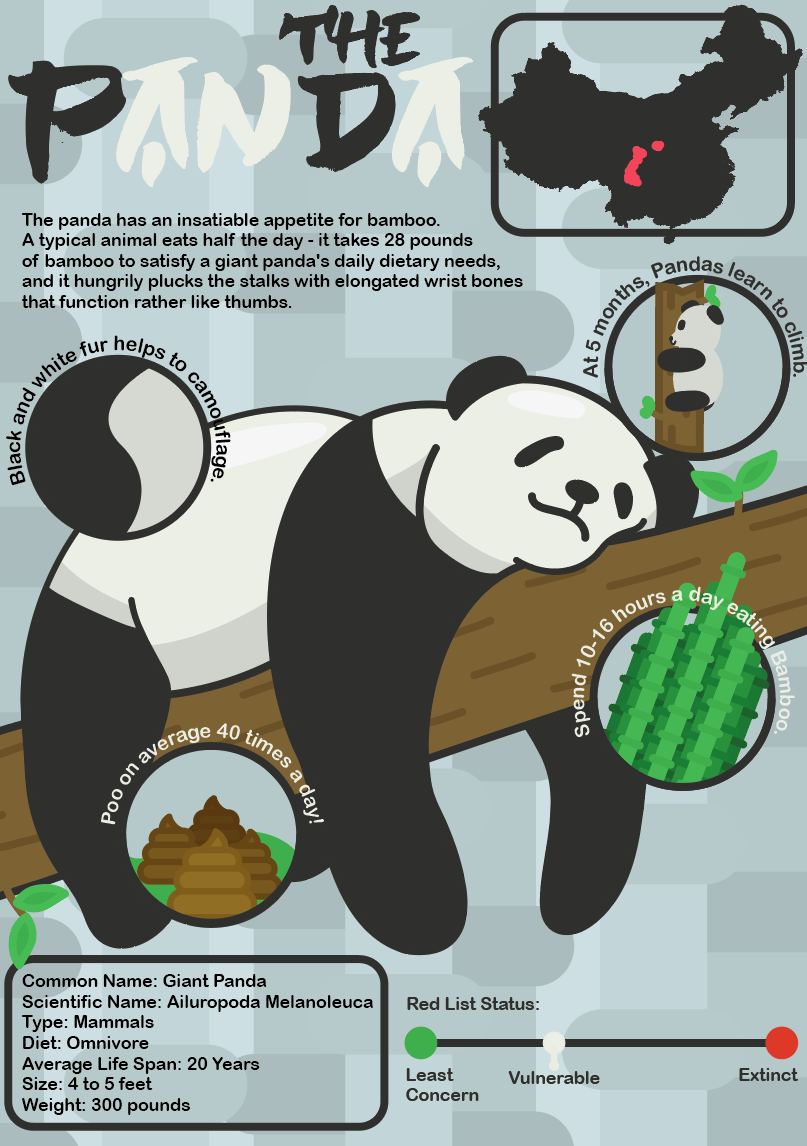
I then added the facts back to the bubbles - however this time, I made the type go around the circle which looked much better. I then added more information about the giant panda below the illustration.
|
|
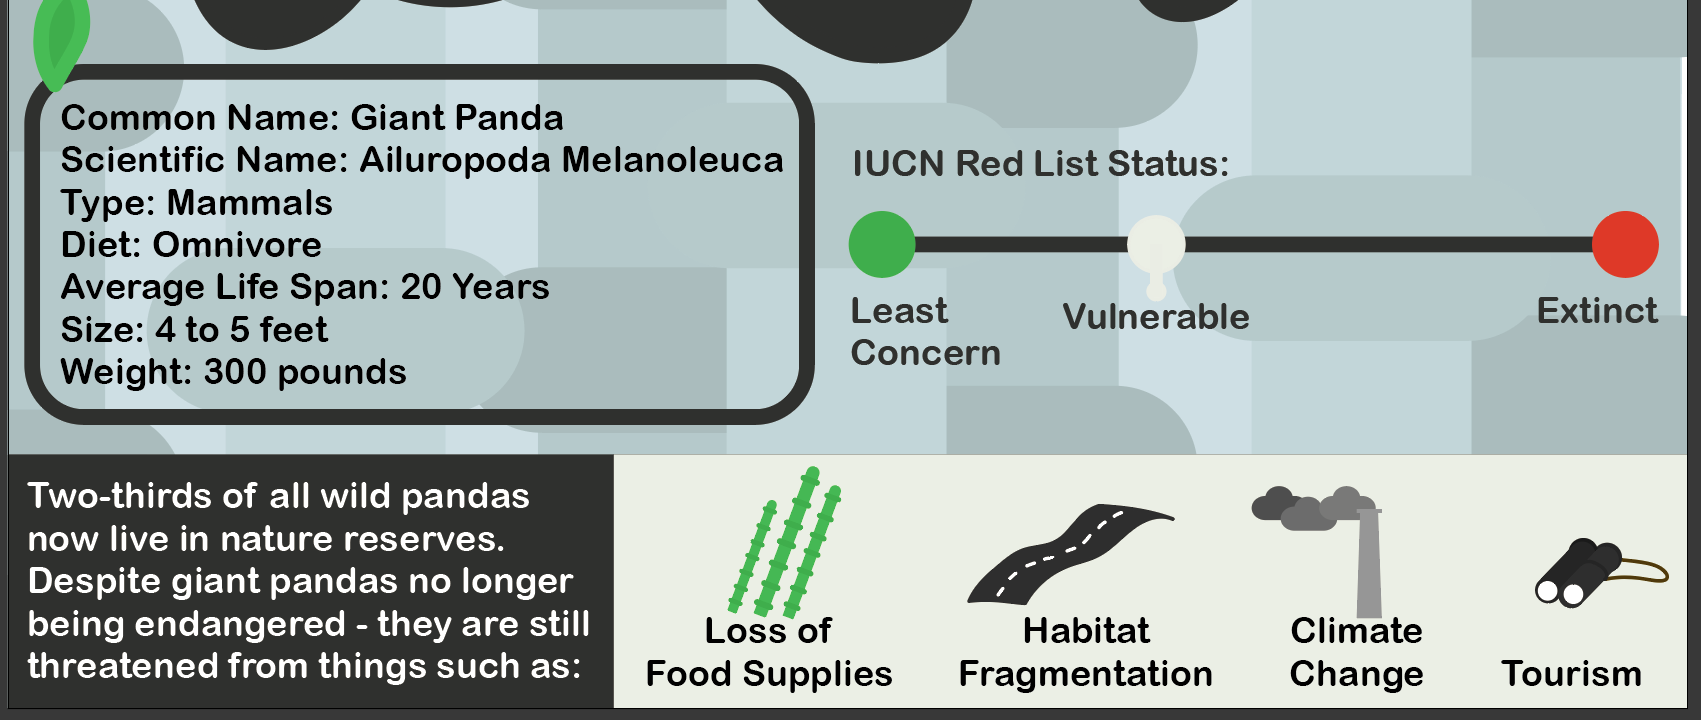
Finally I added another section about ways the panda is being threatened.
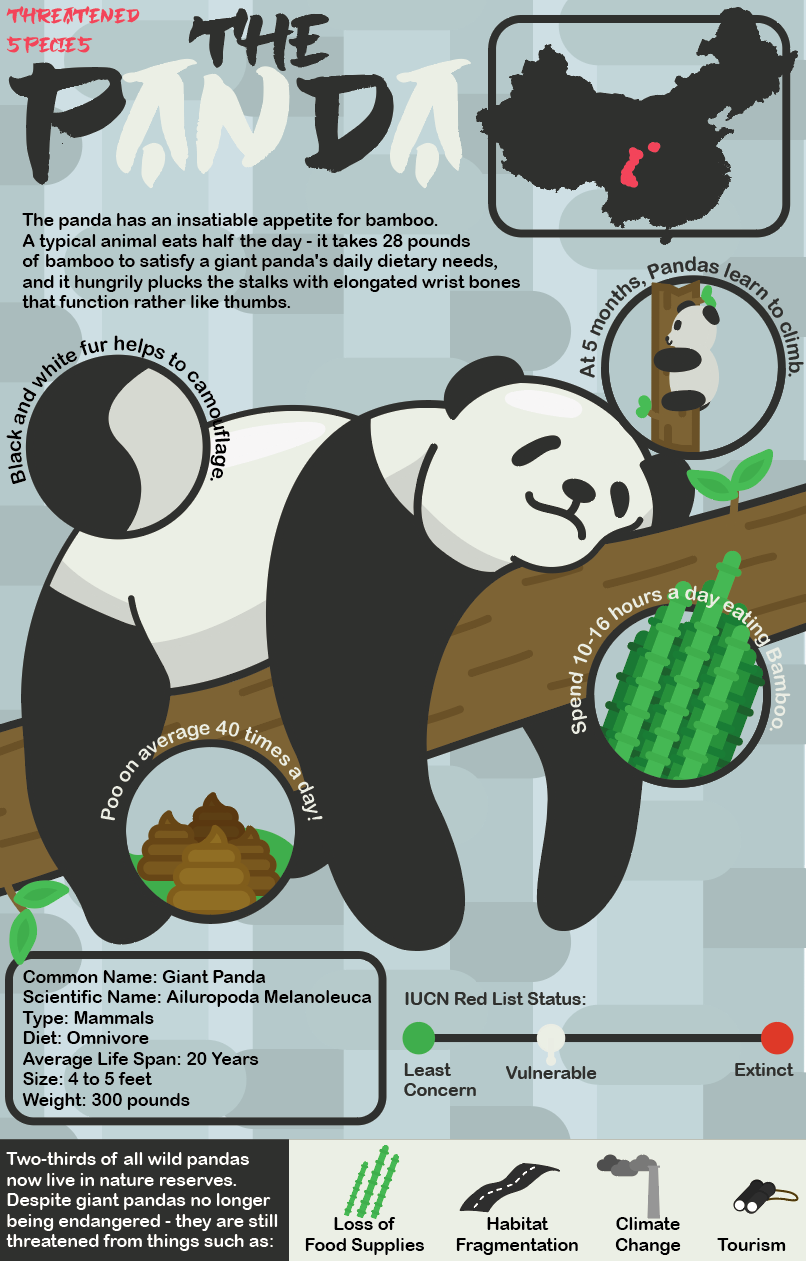
After changing the title, adding a shadow to the title as well as moving a few things around. I made my final outcome which can be seen below. I am happy with this infographic of the giant panda as it came out very well.
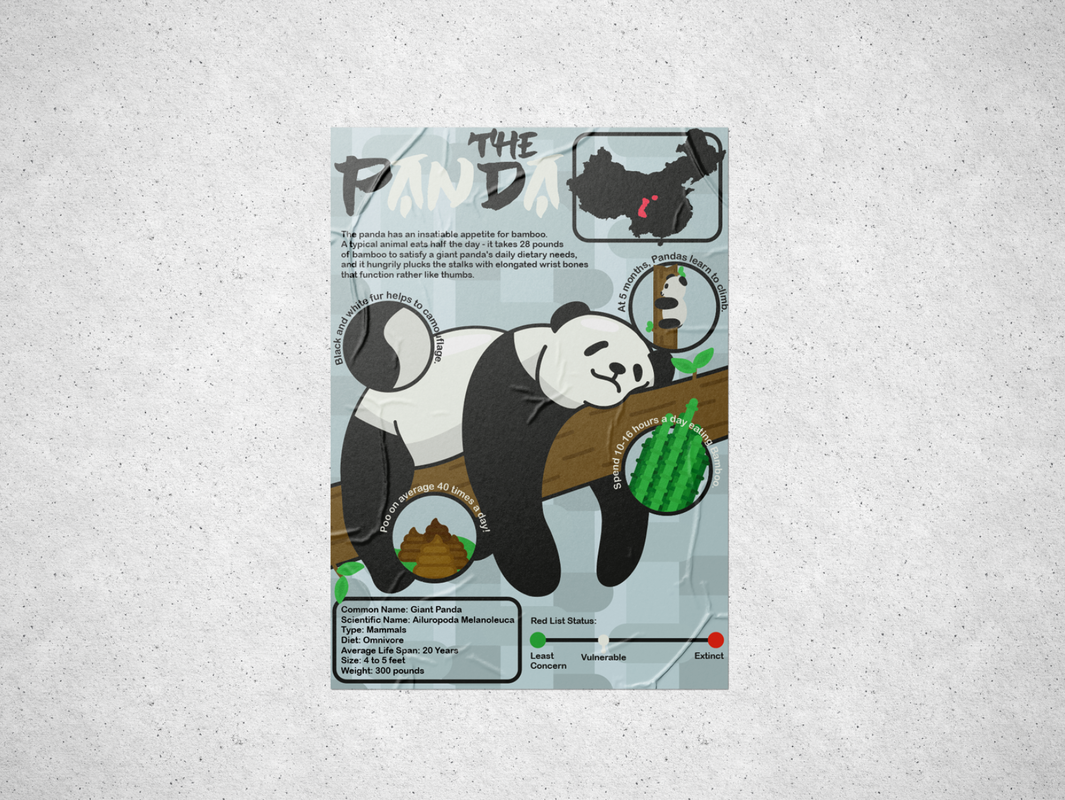
Lastly, I made a mockup of the infographic to see what it would look like as an example on a wall.
| Unit 50: Infographics Design Report |
